| Research Hightlights |
| Events |
| Focus News |
| Upcoming Events |
| Location: Home > News > Research Hightlights |
| Subjected Ancient Slabs form Heterogeneous Seismic Scatterer at the Core Mantle Boundary | TEXT SIZE: A A A |
Previous tomographic studies show that there is a ring of clear high-velocity anomalies around the Pacific Anomaly near the core–mantle boundary (CMB). However, because of inadequate sampling and limited resolution from conventional seismic phases, the detailed structure and origin of these anomalies remain ambiguous.
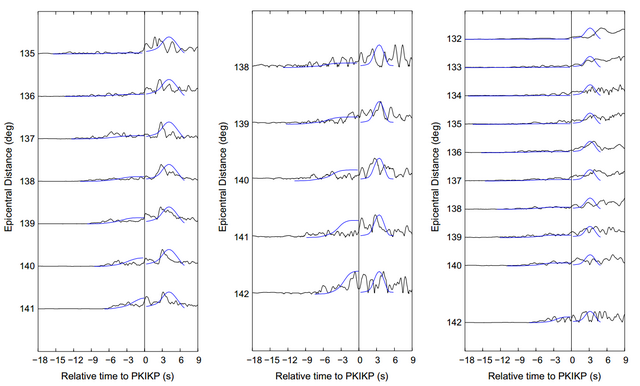
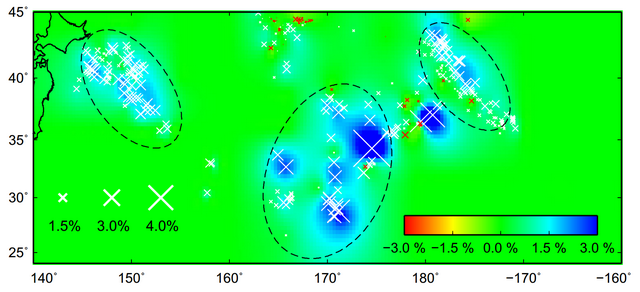
To solve this problem, Prof. SUN Xinlei and his student Xiaolong Ma, together with other co-authors, used an unconventional phase, PKP precursors that diffracted from CMB. They analyze PKP precursors from earthquakes in the Aleutian Islands and Kamchatka Peninsula recorded by seismic arrays in Antarctica, and find that these seismic heterogeneities extend 400 km above the CMB and are distributed between 30° and 45°N in latitude. Of particular interest, the scatterers show the largest P-wave velocity perturbation of 1.0–1.2% in the center (160°–180°E) and 0.5% to the west and east (140°–160°E, 180°–200°E) (Figure 2). ScS–S differential travel-time residuals show similar trends: the middle and the two sides have S velocity variations of about 2.0–3.0% and 1.0–1.5%, respectively (Figure 3). The authors suggest that these seismic scatterers are the remnants of ancient subducted slab material. The lateral variations may be caused either by different slabs, or by variations in slab composition resulting from their segregation process.
This paper has been published in PHYSICS OF THE EARTH AND PLANETARY INTERIORS. Ma, X., Sun, X., Wiens, D.A., Wen, L., Nyblade, A., Anandakrishnan, S., Aser, R., Huerta, Wilson, T., 2016. Strong seismic scatterers near the core-mantle boundary north of the Pacific Anomaly. Phys. Earth Planet. Inter., 253, 21-30.
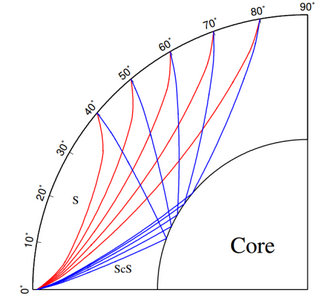
(a) (b) Figure 1. (a) Ray-paths of PKIKP and scattered PKP waves. The PKP precursors are scattered PKP waves generated by the seismic scatterers (black dots) in the lower mantle beneath the source or receiver. (b) Ray-paths of S and ScS waves. (Image by SUN Xinlei)
Figure 2. Observed (black) and synthetic (blue) PKP precursor envelopes for three representative events in three regions. (Image by SUN Xinlei)
Figure 3. Averaged shear wave velocity perturbations at the bottom 400 km of the lower mantle. The background colors are smoothed S velocity perturbations based on our observations. (Image by SUN Xinlei)
Contact: Professor SUN Xinlei Guangzhou Institute of Geochemistry, Chinese Academy of Sciences Email: xsun@gig.ac.cn
|
||
|
|
||


